
Every Health Plan Just Published Its Prior Auth Report Card. Here's the Pattern Underneath the Numbers.
The first permanent record of how plans handle prior auth. What the numbers reveal about your payer accounts.

Upward Growth is a health plan market advisory firm. We work with health tech vendors, investors, provider organizations, and management consultancies to build go-to-market strategy around how health plans actually buy, operate, and make decisions. This weekly newsletter is where we share what we’re seeing in the market.
🤝 Work with Ryan on payor growth strategy: Contact me
🟦 Connect with the author, Ryan Peterson, on LinkedIn.
📰 Newsletter sponsorships are available: Learn More
In January, I wrote about how the prior authorization deadline was already affecting vendor deals. At the time we were 60 days out from the public reporting deadline, and I argued four things: plans would meet the deadline by denying faster rather than deciding better, the friction would simply relocate to appeals and provider relations, public reporting would force plans to answer for their numbers, and the window between the current moment and whatever comes next wouldn’t stay open long.
The March 31st data confirms all four.
For the first time in U.S. healthcare history, every Medicare Advantage (MA) plan and Medicaid Managed Care Organization (MCO) was required to publish what amounts to a prior auth report card: denial rates, approval rates, appeal overturn rates, and decision turnaround times, all posted on the plan’s own public-facing website. Those numbers are now visible, benchmarkable, and permanent.
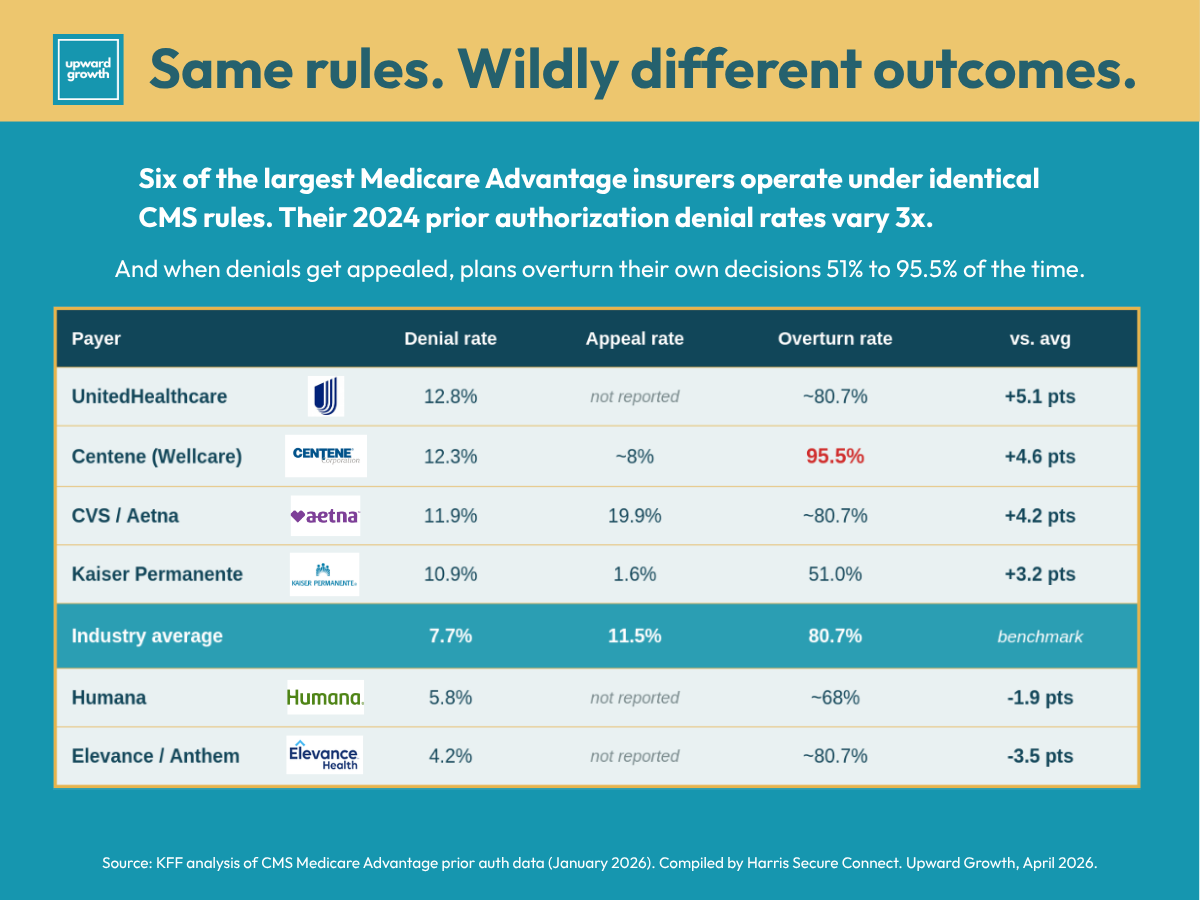
Industry-wide, the MA appeal overturn rate is 80.7%. Four out of five appealed denials get reversed. Only 11.5% of denials are ever appealed, which means providers are walking away from billions in approved care they could have recovered with a letter.
The aggregate numbers are bad. The plan-level variation underneath them is worse, and it is where the real market intelligence lives.
This article walks through what the report cards show, what the data confirms, and how to use the numbers in your next buyer conversation. If you sell into health plans, advise clients who do, invest in companies that do, or work inside a plan and want to see how vendors will read your metrics, the data is working for you now that it couldn’t before March 31st.
What the Numbers Show
Until the March 31st deadline, the industry had no choice but to take payers at their word on prior auth performance. Health plans said their denial rates were reasonable, their appeal processes fair, and their turnaround times competitive. None of that could be independently verified at the plan level until now.
The CMS Interoperability and Prior Authorization Final Rule (CMS-0057-F) required every MA plan, Medicaid MCO, and Children’s Health Insurance Program (CHIP) issuer to publicly post their prior auth metrics by March 31st, 2026. KFF’s analysis of CY2024 CMS submissions sets the industry baseline: 52.8 million MA prior auth requests in 2024, 4.1 million denials, a 7.7% industry-wide denial rate, an 80.7% appeal overturn rate, and an 11.5% appeal rate.
Those are the benchmarks. What makes the data useful is the variation underneath them.
Harris Secure Connect pulled together a compilation of the seven largest MA insurers, which together hold the majority of MA enrollment. Their report gathers the data. I'm going to analyze five of those plans against each other to show the pattern underneath. Same regulatory framework, same March 31st deadline, but very different operational postures.
Centene (Wellcare MA) denies 12.3% of requests and overturns 95.5% of them on appeal. Read that again. Centene issues denials on more than one in ten requests and reverses nearly every single one when a provider pushes back. That is the highest overturn rate in the entire report card, and it is the single most revealing number in the disclosure. The initial determination process is generating decisions that do not survive clinical review. Every other pattern in the data has to be read against this one.
UnitedHealthcare denies at 12.8% with the lowest prior auth volume per enrollee (1.0 request per enrollee). Few requests, high denial rate. The U.S. Senate Permanent Subcommittee on Investigations (PSI) connected that pattern to UHC’s deployment of the nH Predict algorithm, which drove its post-acute denial rate from 8.7% in 2019 to 22.7% in 2022. Humana and CVS were flagged in the same report for similar post-acute denial behavior, though their overall numbers look different.
Elevance (Anthem) denies at 4.2%, the lowest of the majors. Same market, same regulatory framework, very different operational posture. Elevance has publicly committed not to use AI to automate denials, and its PA Pass program waives prior auth entirely for hundreds of procedure codes for qualifying provider groups. This is what operational maturity at the front door looks like in the data.
Aetna (CVS) denies at 11.9% with the highest appeal rate of any major insurer at 19.9%. Providers invest in appeals only when they believe they will land, which makes that 19.9% a signal about what providers experience with Aetna denials. When providers are willing to push back at almost double the industry rate, they are telling you something about the initial review process.
Kaiser Permanente denies at 10.9% with a 1.6% appeal rate and a 51% overturn rate. The headline denial rate looks similar to the others, but the 1.6% appeal rate is the story. Kaiser's integrated model means the provider making the request and the plan denying it are often the same organization, which collapses the (often) adversarial dynamic that drives appeal behavior everywhere else. The data reflects it: very few appeals, and only half of those filed are overturned. (Kaiser is not a useful benchmark for any plan that doesn't share its structure.)
The Medicaid picture is starker. The Office of Inspector General’s (OIG) 2019 baseline put MCO denial rates at 12.5%, more than double the MA rate at the same time, and the overturn rate on Medicaid appeals is only 36%, less than half the MA rate. The gap comes down to accountability structure. In MA, a denial upheld on internal appeal automatically routes to an independent external review. Only 15 of 39 MCO states have an equivalent external review requirement for Medicaid, and 89% of Medicaid enrollees never appeal. Same denial behavior, but far less backstop.
Cigna is the outlier worth watching. They published their first Customer Transparency Report on March 12, nearly three weeks before the deadline, reporting that fewer than 2% of customers receive a prior auth denial and that 80% of prior auths are approved within 24 hours. They also removed 345 services from their PA list, a 15% reduction. Publishing early was a strategic choice. Expect Cigna to use those numbers in the 2027 bid cycle.
There is more to the numbers than what appears on the surface. Here's what they confirm about how plans handled the March 31st deadline.
What the Data Confirms
Health plans have not been sitting still. On April 7, AHIP and the Blue Cross Blue Shield Association reported that the roughly 50 insurers who signed the June 2025 voluntary prior auth pledge have eliminated 11% of prior authorizations since the commitment, reducing 6.5 million requests and achieving MA reductions of more than 15%. Plans are pulling procedures off PA lists, building continuity-of-care protocols for members who switch coverage, and working toward real-time electronic determinations on the 2027 FHIR timeline.
But reducing the volume of prior auths does not automatically improve the quality of the ones that remain, and the CY2024 data confirms that. Four patterns I flagged in January now have the numbers to back them up:
Plans met the deadline by denying faster. Centene is the cleanest case study. A 95.5% overturn rate on a 12.3% denial rate means the initial decisions are not surviving clinical review. That pattern only occurs when decisions are made faster than they should. The American Medical Association’s (AMA) 2024-2025 prior authorization survey puts physician burden at 39 prior auths per physician per week and 13 hours of staff time, and 61% of physicians reported concerns that plans were using AI to increase denials with minimal human review. The data confirms what providers were already living.
Compliance relocated friction rather than eliminating it. The industry-wide 80.7% overturn rate is the evidence. Friction moved downstream into appeals, where it now sits in a different cost center and a different part of the member experience.
Plans with poor numbers are starting to face questions from brokers, consultants, and members. The disclosures are public, benchmarkable, and already being referenced by advocacy groups and trade press. Plans cannot claim their prior auth numbers are defensible without being prepared to answer for them in every renewal conversation and every member-facing review cycle.
The window on this data is short. This is the pattern that matters most because every other insight in this article is most useful right now. In 90 days, the industry will be talking about CY 2027 bids, summer enrollment, and the next CMS drop. The data will still be public, but vendors who show up in Q3 referencing it will be walking into rooms where five competitors already did.
Pull up your prospect's prior auth numbers before your next meeting. Even if you don't sell prior auth, they tell you something about how the plan operates that most of your competitors haven't bothered to look up.
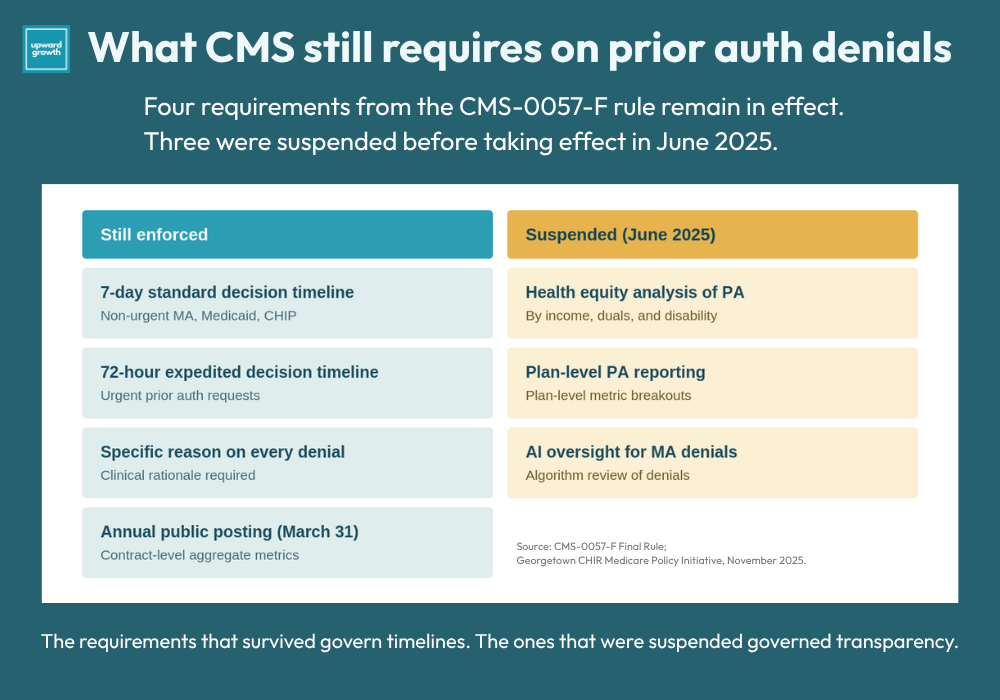
Two things have shifted since my January article. The Trump administration pulled three of the original CMS-0057-F requirements in June 2025. Health equity analysis of prior auth practices is no longer required, plan-level reporting was reduced to contract-level aggregate data, and the AI oversight requirements for MA denial systems were dropped. What is still enforced: the 7-day standard and 72-hour expedited decision timelines, contract-level reporting, specific denial reasons on every denial, and the annual public posting. The transparency infrastructure held even under a deregulatory administration, which tells you something about where CMS has conviction and where it does not.
One thing CMS did not mandate was where plans had to post the data. The numbers live in different spots on different plans’ websites, some on compliance pages, some in provider sections, some in footer links that take three clicks to reach. The information is there, but vendors and consultants who want to read these numbers have to look for it. Most won’t, and that is part of why the window is open for the ones who do.
The second shift is on the horizon. The Fast Healthcare Interoperability Resources (FHIR) Prior Authorization Application Programming Interface (API) mandate takes effect January 1, 2027, which means the technology that would let plans make better initial decisions at scale arrives in eight months. Between now and then, plans are operating on the manual infrastructure they built to hit the January 2026 deadline, and that infrastructure is exactly what produced the 80.7% overturn rate. The report cards you are reading today are the best-case output of a system that wasn’t built for the job it is being asked to do.
So pull up your prospect’s prior auth numbers before your next meeting. Even if you don’t sell prior auth, they tell you something about how the plan operates that most of your competitors haven’t bothered to look up.
The Four Patterns Worth Recognizing in the Data
Having the data matters less than knowing what it means. Most vendors will read the report cards, note the big numbers, and move on. Those who get something useful from the disclosure are those who read plan-level patterns as operational signals.
Four patterns are worth learning to recognize. Each one shows up in different parts of the market, and each one points to a different buyer situation:
High denial rate plus high overturn rate equals an initial determination problem. Centene is the archetype, with a front-door process that produces decisions that collapse on appeal. If you sell clinical decision support, documentation improvement, utilization management (UM) workflow tooling, or anything that touches first-pass decision quality, you have a data-backed hook. The plan’s own numbers show the initial process is not working, and the downstream costs in appeals volume, provider abrasion, and member experience hits are known and real.
High denial rate plus low appeal rate equals a provider relations problem. When providers stop appealing despite high denial rates, they have decided the effort isn’t worth the return. That disengagement affects network adequacy, network stability, and eventually Consumer Assessment of Healthcare Providers and Systems (CAHPS) scores, which feed into Stars. KFF polling already shows that most insured adults find prior auth difficult to manage, so member experience is a documented pressure point before you factor in broken initial decisions. If you sell provider engagement, network management, or member engagement solutions, the data points you toward the right accounts and conversations.
Low denial rate equals operational maturity at the front door. Elevance and Cigna have already invested in the front end. (i.e., Selling UM tools into those plans might be harder.) Quality, care management, and clinical workflow tools may be an easier fit because they are the next layer up the stack, and those plans have shown interest in investing there.
Missing or late disclosures equal a compliance bandwidth problem. A plan that did not publish on time or published only the minimum contract-level aggregate is sending a signal. It is either short on compliance capacity or deliberately minimizing its exposure, and both readings argue for the same vendor posture: calibrate your ask to what their team can actually absorb.
The pattern-recognition layer matters because the data itself is a commodity. Every vendor has access to the same numbers. What the vendor does with those numbers, how they frame them in discovery, what they ask, how they read silence, is where the insight actually lives.

Everything above is the public data and the framework for reading it: what the numbers show, what they confirm about how plans handled the January deadline, and the four buyer patterns worth recognizing. Below is what I actually use with clients: discovery language for a high-denial plan, an operationally mature plan, and a non-publisher, plus the one-page champion brief that turns the plan’s own numbers into an executive conversation.
Paid subscribers get this section plus the full archive of frameworks, scripts, and deep dives.
🔒 Upgrade to a paid subscription to keep reading.